Cardboard Recycling Statistics: U.S. Rates, Tonnage, and What Each Number Measures
What are the key cardboard recycling statistics?
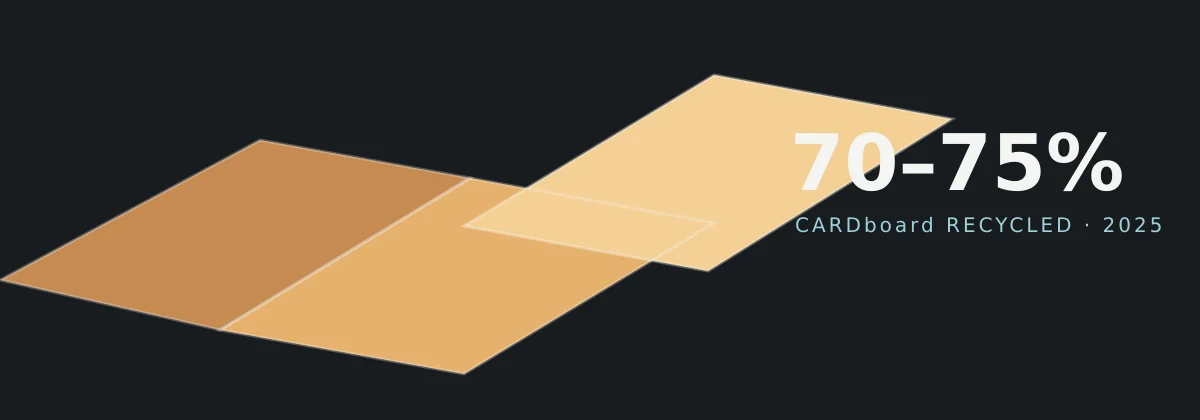
The U.S. cardboard recycling rate was 70–75% in 2025, according to AF&PA’s estimate of cardboard recycled against cardboard available for recovery. EPA’s 96.5% describes 2018 under a different method, so the figures cannot establish a decline. AF&PA’s 2025 release; EPA’s 2018 tables.
-
70–75% of U.S. cardboard available for recovery was recycled in 2025, according to the American Forest & Paper Association’s estimate, released August 28, 2026. AF&PA source.
-
Wisconsin’s reporting MRF cardboard shipments increased 42.2% from 2015 to 2024, reaching 332,954 tons, calculated here from Wisconsin DNR figures; this is tonnage growth, not a recycling-rate increase. Wisconsin DNR source.
-
More than 33 million tons of cardboard were recycled in the United States in 2025, according to AF&PA; the association describes the daily scale as about 90,000 tons. AF&PA source.
-
EPA’s published U.S. corrugated-box recycling rate is 96.5% for 2018, calculated as estimated recycling divided by estimated generation and published in December 2020—not a 2025 rate. EPA source.
-
69–74% of U.S. cardboard available for recovery was recycled in 2024, according to AF&PA’s estimate, released August 12, 2025. AF&PA source.
-
U.S. mills used 31.4 million tons of recycled paper in 2025, down 1.3 million tons from 2024, according to AF&PA; this covers recycled paper, not cardboard alone. AF&PA source.
-
Corrugated boxes were EPA’s largest single MSW product category in 2018: 33.26 million U.S. short tons generated, or 11.4% of MSW generation, according to EPA’s estimates. EPA source.
-
EPA estimated 940,000 U.S. short tons of corrugated boxes were landfilled and 230,000 short tons were combusted with energy recovery in 2018. EPA source.
-
Corrugated was 48.4% of reported Wisconsin MRF end-market shipments in 2024, up from 31.7% in 2015, calculated here from Wisconsin DNR tonnages; this is an output-composition share. Wisconsin DNR source.
-
All materials other than corrugated combined fell 29.7% in reported Wisconsin MRF output from 2015 to 2024; corrugated rose 42.2%, and the all-material total fell 6.9%. These changes are calculated here from Wisconsin DNR’s published totals. Wisconsin DNR source.
-
In 2019, corrugated first exceeded all other paper combined within Wisconsin DNR’s 2015–2024 MRF series: 306,621 tons against 271,346 tons. The crossover was identified here from the published figures. Wisconsin DNR source.
-
71–76% of U.S. cardboard available for recovery was recycled in 2023, according to AF&PA’s estimate, released November 14, 2024. AF&PA source.
-
U.S. containerboard production fell 4.4% to 36.1 million tons in 2025, while recovered-fiber consumption fell 4.0%, according to AF&PA’s 66th annual capacity and fiber-consumption survey. AF&PA source.
-
The U.S. corrugated recyclable paper price index rose 35.3% from November 2025 to August 2026, calculated here from BLS series WPU091203 as retrieved September 15, 2026; the series is not seasonally adjusted and is an index, not dollars per ton. BLS/FRED source.
-
Brown County hauled 24,697 tons of single-stream recyclables to the Tri-County MRF in 2025, according to its detailed annual-report recycling section; that is all-material throughput, not cardboard-only tonnage. Brown County source.
-
As verified September 15, 2026, Wisconsin’s cardboard disposal ban applies to residential and nonresidential generators statewide, subject to the exceptions described by Wisconsin DNR, including specified energy-recovery areas. Wisconsin DNR source.
By Green Bay Dock Door Repair Research
Last verified: September 15, 2026
National data edition: 2025. Historical, state, county and price-index reference periods are labeled individually.
The original state finding is just as clear: reported Wisconsin cardboard shipments rose while all other materials combined fell. The tables below preserve the quantities, calculations and reporting boundaries behind that finding. Wisconsin DNR end-market table.
On this page: Key statistics · The current U.S. rate · How many tons · What EPA’s 96.5% measures · Why these numbers cannot be spliced · Terms · How this was built · Dataset files · Wisconsin, 2015–2024 · Brown County · Recovered-cardboard prices · Disposal restrictions · Why the numbers are moving · Limitations · How to cite this page · FAQ · Sources · Verification record
What is the U.S. cardboard recycling rate right now?
The latest AF&PA rate available at this verification date is 70–75% for 2025, released August 28, 2026. It is a range because parts of the calculation are estimates, and it measures cardboard recycled against cardboard available for recovery—not simply cardboard produced. The verified national figures below retain their own publisher, year and denominator. AF&PA release; AF&PA methodology.
Table 1. Published U.S. cardboard recycling rates, with the measurement behind each
| Publisher / method | Rate | Data year | Numerator | Denominator | Published | Tier |
|---|---|---|---|---|---|---|
| U.S. EPA | 96.5% | 2018 | Estimated corrugated boxes recycled | Estimated corrugated boxes generated | Dec 2020 | ★ |
| AF&PA, current method | 71–76% | 2023 | Cardboard recycled under AF&PA’s adjusted calculation | Cardboard available for recovery | Nov 14, 2024 | ★ |
| AF&PA, current method | 69–74% | 2024 | Cardboard recycled under AF&PA’s adjusted calculation | Cardboard available for recovery | Aug 12, 2025 | ★ |
| AF&PA, current method | 70–75% | 2025 | Cardboard recycled under AF&PA’s adjusted calculation | Cardboard available for recovery | Aug 28, 2026 | ★ |
Source: Green Bay Dock Door Repair Research compilation of EPA’s 2018 tables, AF&PA’s 2023, 2024 and 2025 releases, and AF&PA’s methodology. Verified September 15, 2026. ★ = the stated figure was read directly in the producer’s publication; it is not an audit of confidential underlying records.
Dataset: National recycling-rate ledger — CSV. Includes publisher, rate name, data year, published range, numerator, denominator, method, source URL, publication date and verification date.
What changed in AF&PA’s methodology?
AF&PA identifies four changes: more detailed estimates of net imported product packaging; deductions for unusable material and net moisture in recovered bales; adjustments for cardboard and other consumer paper packaging across bale grades; and publication as ranges. It also reports that it commissioned an outside methodological review. Those are the producer’s descriptions, not an independent validation performed by this publication. AF&PA methodology.
A change in the formula can change a published rate without an equivalent change in physical recycling. It does not follow that every difference between two years is methodological, or that the current range is directly comparable to an older calculation. No unverified restated historical rate is used to assign an exact percentage-point effect here.
What “available for recovery” actually means
The distinction is between production and material available to become recovered fiber. AF&PA’s method includes packaging carried with imported and exported products, not just trade in paper products themselves. Its calculations also adjust for material composition and unusable bale content; those adjustments should not all be described as one change to the denominator. AF&PA methodology.
Dividing by a different denominator changes the result, even before any recovery adjustment. But national recovery minus domestic board shipments does not isolate packaging imports. A matched material balance would also need consistent product boundaries, trade treatment, period and units. That subtraction is not used as an import estimate anywhere in this ledger.
Why some historical rates are not in the numerical ledger
The original numerical publications for AF&PA’s previous-method and restated 2022 rates, and for the Bloomberg Intelligence/Circular Ventures estimates discussed in trade reporting, were not directly verified in this pass. They are excluded rather than presented with a provisional verification symbol. The Circular Ventures access page is not a substitute for inspecting its numerical presentation.
This is a selected, verified ledger—not a claim to reproduce every rate ever published. Leaving an unverified value out is different from declaring it wrong.
How much cardboard does the U.S. actually recycle, in tons?
AF&PA reports more than 33 million tons of cardboard recycled in 2025, about 90,000 tons a day. Its wider recycled-paper and production figures describe different material streams and should remain separately labeled. None of those totals, subtracted from another, directly measures imported cardboard packaging. AF&PA cardboard figures; AF&PA production survey.
Table 2. U.S. cardboard recovery and paper-industry production scale
| Measure | Figure | Data year | Kind / material scope |
|---|---|---|---|
| Cardboard recycled | More than 33 million tons | 2025 | AF&PA estimate; lower bound, not an exact total |
| Paper recycled | About 45 million tons | 2025 | AF&PA estimate; broader than cardboard |
| U.S. paper and paperboard production | 66.3 million tons, down 3.7% | 2025 | AF&PA survey-based industry figure; production, not recovery |
| Containerboard production | 36.1 million tons, down 4.4% | 2025 | AF&PA survey-based industry figure |
| Containerboard capacity / operating rate | Capacity down 5.1%; operating rate 91.9% | 2025 | AF&PA survey-based industry figures |
| Recycled paper used by U.S. mills | 31.4 million tons, down 1.3 million tons from 2024 | 2025 | AF&PA figure; all recycled paper |
| Recovered-fiber consumption | Down 4.0% | 2025 | AF&PA survey-based change |
| Share of recycled paper going into containerboard | Nearly half | 2025 | AF&PA qualitative share; no invented exact percentage |
Source: AF&PA’s cardboard explainer, August 28, 2026 release, recycling facts and 66th Annual Paper Industry Capacity and Fiber Consumption Survey. Verified September 15, 2026. All units and qualifiers are retained as published. These are different production, consumption and recovery measures, not parts of one closed balance.
Dataset: U.S. tonnage and production ledger — CSV. Includes measure, value, unit, reference year, qualifier, scope, source and verification date. “More than” and “about” are retained; “nearly half” is not converted into an invented exact percentage.
The arithmetic, shown—and its evidence boundary
Converting area to weight is straightforward when the area and basis weight cover the same board and period:
board area in square feet ÷ 1,000
× basis weight in pounds per thousand square feet
÷ 2,000 pounds per U.S. short ton
= estimated short tons of board
The conversion does not establish whether the area and average basis weight are compatible, or whether either input is correct. The Fibre Box Association’s 2024 annual-report catalog entry was available, but the report’s numerical tables were not independently inspected. This edition therefore publishes no FBA shipment area, shipment value, plant count, average basis weight or board-type share, and no derived shipment-weight result from those inputs. The short-ton conversion is documented by NIST.
Four boundaries matter to anyone repeating a production-versus-recovery calculation. An average must match the area it weights. Shipped finished board and recovered material are different flows. Bale composition and moisture need consistent treatment. The time period and ton unit must match. Arithmetic can be reproducible and still answer the wrong question.
For those reasons, a gap between recovered cardboard and shipped board cannot be labeled “the imported packaging the old formula missed.” AF&PA’s own trade-and-packaging calculation is the source for that methodological issue, not a subtraction between unrelated industry totals. AF&PA methodology.
An arithmetic check using AF&PA’s own figures
AF&PA reported about 45 million tons of paper recycled in 2025 and 31.4 million tons consumed by U.S. mills. Subtraction gives an approximate residual of 13.6 million tons. That result is not a separately measured export total and is not an independent validation of AF&PA’s model. AF&PA’s 2025 release.
about 45.0 million tons of paper recycled
− 31.4 million tons consumed by U.S. mills
= about 13.6 million tons, an arithmetic residual
The input precision and material boundaries limit what the residual can establish. This page does not convert it into a precise export percentage, call gross and net exports interchangeable, or use it to validate the cardboard-only rate.
What does EPA’s 96.5% figure actually measure?
EPA’s 96.5% is a real federal estimate for calendar year 2018, published in December 2020. It divides estimated corrugated boxes recycled by estimated corrugated boxes generated, within EPA’s municipal-solid-waste material accounting. The EPA pages checked for this edition still present 2018 as their corrugated-box baseline. EPA tables; EPA material-specific page.
Table 3. EPA’s 2018 corrugated-box material balance, with historical context
| Measure | Data year | Value |
|---|---|---|
| Corrugated boxes generated | 2018 | 33,260,000 U.S. short tons |
| Corrugated boxes recycled | 2018 | 32,090,000 U.S. short tons |
| Corrugated-box recycling rate | 2018 | 96.5% |
| Combusted with energy recovery | 2018 | 230,000 U.S. short tons |
| Landfilled | 2018 | 940,000 U.S. short tons |
| Corrugated share of all MSW generated | 2018 | 11.4% — largest single product category in EPA’s MSW classification |
| Corrugated-box recycling rate | 2000 | 67.3% |
| All paper and paperboard recycling rate | 2018 | 68.2% |
Source: U.S. EPA, Advancing Sustainable Materials Management: 2018 Tables and Figures, Table 5, printed page 6; Table 25, printed page 39 for the 2000 comparison; and Containers and Packaging: Product-Specific Data for the MSW share and product-category description. Published table values expressed in thousands of tons are multiplied by 1,000 above. Verified September 15, 2026.
The balance closes exactly: 32,090,000 + 230,000 + 940,000 = 33,260,000. We re-ran it on September 15, 2026. That is a check on the arithmetic of EPA’s published entries, not on whether the underlying generation model is right.
Dataset: EPA material balance and reference-year ledger — CSV. The 2000 comparison remains labeled 2000; it is not represented as another 2018 observation.
Why “all paper” is a different number
EPA’s 68.2% covers the wider paper-and-paperboard category in municipal solid waste. Its 96.5% covers corrugated boxes within that category. Using the all-paper number to answer a corrugated-box question substitutes a different denominator; using the corrugated-box figure for all paper does the same in reverse. EPA Table 5.
“Municipal solid waste” also has a boundary. EPA’s tables exclude construction and demolition debris, industrial process wastes and certain other wastes from that accounting. A corrugated share of MSW must not be relabeled a share of every kind of U.S. waste. EPA Table 1 notes.
The product-category description matters just as much as the percentage. EPA calls corrugated boxes its largest single product category; that does not mean corrugated exceeds every broader material or other-waste category in the full waste stream. EPA’s product-specific description.
Why can’t these percentages be strung into one trend line?
They cannot, because they are not estimates of the same thing. EPA’s 96.5% for 2018 followed by AF&PA’s 70–75% for 2025 does not establish a collapse: the figures have different publishers, reference years and measurement frameworks. This compilation contains no harmonized series that bridges them. EPA tables; AF&PA methodology.
Table 4. What each measurement describes, and what it cannot be used for
| Measurement | What it describes | What it does not establish |
|---|---|---|
| AF&PA cardboard rate | National recycling estimate relative to cardboard available for recovery | An individual box outcome or a continuous series with EPA |
| EPA corrugated-box rate | Historical recycling relative to estimated generation | A current rate or an AF&PA trend baseline |
| Independent model without verified underlying publication | A separate producer estimate requiring its own methods and reference year | A verified numerical rate in this edition |
| Wisconsin MRF cardboard share | Composition of reported shipments to end markets | A statewide cardboard recovery or capture rate |
| Brown County transfer-station tonnage | All-material single-stream throughput on a reported route | County cardboard-only recovery |
Source: comparison rules written by Green Bay Dock Door Repair Research from AF&PA’s method, EPA’s tables, Wisconsin DNR’s output table, DNR’s dataset descriptions and Brown County’s report. The independent-model row records an evidence boundary, not a verified numerical result. Verified September 15, 2026.
The attribution that preserves the fact. Name the publisher, the data year and the denominator in the same sentence. “AF&PA estimates 70–75% of U.S. cardboard available for recovery was recycled in 2025” identifies the finding. “Almost all cardboard is recycled” does not preserve that measurement. AF&PA’s 2025 release.
A range should also remain a range. Its midpoint is not a separately published estimate, and AF&PA’s explanation does not identify it as a reported statistical confidence interval. This page neither invents midpoints nor assigns statistical significance to overlapping annual ranges. AF&PA’s explanation of ranges.
What do these terms actually mean?
Six terms do much of the confusing work in this subject, and changing one changes the number being described. “Cardboard” is not a license to treat every paper package as an identical material: EPA’s corrugated category, Wisconsin’s OCC row and AF&PA’s adjusted cardboard calculation have their own boundaries. EPA Table 5; Wisconsin DNR table; AF&PA methodology.
Cardboard measurement terms
| Term | Plain meaning |
|---|---|
| Corrugated | Board made from fluted medium bonded to linerboard. Single-wall board has one fluted layer between two flat liners; other constructions exist. |
| Paperboard / boxboard | Paperboard is a broader material family, not a synonym for noncorrugated cartons. Boxboard is used for folding or set-up cartons such as cereal and shoe boxes. |
| OCC | Old corrugated containers or old corrugated cardboard: recovered corrugated material. The exact material boundary follows the dataset or commodity specification. |
| Containerboard | Linerboard and corrugating medium: the paper components used to make corrugated board. |
| Basis weight | Mass per unit area. A pounds-per-thousand-square-feet value can convert a matching board area to estimated pounds; it does not supply a recycling denominator. |
| Materials recovery facility (MRF) | A facility that processes recovered materials. Wisconsin’s end-market series measures reported material shipments out, not everything placed in household bins. |
Source: definitions assembled from Fibre Box Association’s corrugated description, Connecticut’s boxboard and cardboard definitions, AF&PA’s methodology and Wisconsin DNR’s MRF guidance. The basis-weight conversion is a dimensional calculation, not an independently measured industry-average value. Verified September 15, 2026.
Single-wall is one construction, not the definition of all corrugated. Likewise, “paperboard” is broader than a cereal-box example. That distinction keeps a packaging description from silently changing the category used in a recycling statistic. Fibre Box Association; Connecticut definitions.
How was this ledger assembled?
This edition was checked against the cited producers’ publications on September 15, 2026. Source years and publication dates are recorded separately, and all displayed Wisconsin and price-index calculations were re-run for this edition. The work is a joined evidence ledger and reproducible analysis, not a new national survey.
What we collected, and from where
We checked current national rates against AF&PA’s own releases and its rate-methodology page. EPA’s exact corrugated tonnages came from Table 5 of the 2018 Tables and Figures report; the 2000 comparison came from Table 25. These are different source series, preserved separately rather than forced into one trend. AF&PA release; EPA source tables.
We transcribed the Wisconsin material series from DNR’s December 2025 end-market table and checked the Brown County totals against the labels in its annual-report recycling chart. We retrieved the BLS price index through FRED, retaining the source’s September 10, 2026 update and all eleven displayed monthly observations. PDF table and chart labels were visually inspected, not inferred from neighboring years. Wisconsin source table; county annual report; BLS/FRED observation table.
The Wisconsin Policy Forum paragraph is attributed to that organization’s original analysis of responsible-unit data. We verified its published analytical findings, not the underlying 2013 reporting returns. The law summaries were checked against the issuing agencies’ own guidance and, for the cited Connecticut provision, the state’s regulation text. No secondhand historical rate was promoted into the verified numerical ledger.
What we calculated
The original calculations are Wisconsin OCC’s share of total facility output and of paper-fiber output, annual OCC changes, decade changes by material, the first OCC-versus-other-paper crossover within the supplied series, and price-index changes between named months. Source totals are inputs; those shares and changes are this publication’s analysis. The formulas appear beside the tables and in the reproduction script.
OCC output share = OCC tons / published total tons × 100
OCC share of paper fiber = OCC tons / (OCC tons + all other paper tons) × 100
Change in tons = end-period tons − start-period tons
Percentage change = (end-period value / start-period value − 1) × 100
All materials except OCC = published total tons − OCC tons
Share change, percentage points = end-period share − start-period share
Calculations use the source inputs before final rounding. Displayed shares and changes use one decimal place; source tonnages remain whole reported tons; price-index observations retain three decimals. Percentage-point differences are not percent changes. For example, Wisconsin OCC’s output share increased 16.7 percentage points from 2015 to 2024; the separate 42.2% finding is growth in reported OCC tons. Wisconsin DNR inputs.
Three checks we ran
EPA’s published balance. Recycled, combusted and landfilled corrugated quantities sum exactly to the published generation quantity. That verifies transcription and arithmetic, not the estimation model.
Wisconsin’s totals and calculations. The sums of the six material entries differ from the published totals by no more than two tons in any year. We retain the published totals, record those small differences in the CSV, and do not assign a cause that DNR has not stated. “Everything except corrugated” is calculated as the published total minus OCC, so the calculation can be reproduced without silently substituting a different total. DNR source table.
Price-index and file consistency. We checked the named-month changes from the corrected BLS/FRED observations and validated that the CSV and JSON records match. The reproduction script also checks the EPA balance, Wisconsin shares, year-over-year changes and decade findings. It does not recreate AF&PA’s national model or audit individual facility returns.
What could not be verified for publication
The FBA annual-report numerical inputs and the historical or independent rates identified above are excluded. The available publisher catalog and presentation-access pages establish where those resources belong; they do not establish their numerical contents. The source manifest records that distinction, and no calculated tonnage is built on an uninspected input. FBA catalog; Circular Ventures access page.
Verification tiers and source conflicts
★ means the value or requirement was checked in the named producer’s publication, agency guidance or official regulation. It does not imply direct inspection of every underlying survey response. There are no provisional ● numerical claims in this edition.
When a source contains inconsistent values, this page identifies the conflict and states which labeled record is used. Brown County’s detailed recycling text and chart both report 24,697 tons for 2025, while the director’s introduction says 24,500 tons. The dataset uses the detailed record, carries the discrepancy as a note, and does not average the figures. Brown County report, printed pages 1 and 5.
What this page adds
The original contribution is the joined ledger, compatible definitions, reproducible Wisconsin composition and change analysis, and a county record whose missing cardboard fields stay missing. The measurements remain the work of their named producers. This page does not claim to be the first publication anywhere to discuss those sources or to have performed a new national survey.
Dataset files and their contents
The files below contain this September 15, 2026 verification snapshot. They use the same inputs as the visible tables, with source URLs and scope notes rather than a separate, undocumented set of figures.
National rate ledger — CSV: four directly verified national rate records, with reference years, denominators and source vintages.
U.S. tonnage and production ledger — CSV: cardboard recovery and wider paper-production context, with qualitative and lower-bound values preserved.
EPA material balance — CSV: historical quantities and separately dated rate comparisons.
Wisconsin MRF series — CSV: ten years, all six material categories, published totals, output shares, paper-fiber shares and OCC year-over-year changes.
Wisconsin decade changes — CSV: start and end quantities, changes, formulas and aggregation rules.
Brown County transfer-station series — CSV: five all-material throughput observations, source-conflict notes and empty cardboard-only fields.
Corrugated recyclable paper index — CSV: October 2025 through August 2026 observations, series metadata and retrieval vintage.
Selected state disposal-rule references — CSV: four jurisdiction summaries, source URLs, conditions and verification date.
Complete dataset — JSON: the table records, definitions, compatibility rules, original calculations, exclusions and source manifest.
Source manifest — CSV and reproduction script — Python: provenance and executable arithmetic checks.
Missing numeric CSV cells and JSON null mean unavailable or not applicable, not zero. “More than 33 million” remains a lower-bound statement; “nearly half” remains qualitative. The files do not authorize treating an excluded or missing measurement as a value to be filled from memory.
What happened to Wisconsin’s cardboard between 2015 and 2024?
Wisconsin’s self-certified materials recovery facilities reported shipping 332,954 tons of old corrugated cardboard to end markets in 2024, up 42.2% from 2015. Over the same period, all other reported materials combined fell 29.7%, and the “all other paper” category fell 45.0%. Corrugated reached 48.4% of reported output, up from 31.7%. Wisconsin DNR end-market table; changes calculated here.
Wisconsin publishes the inputs together in one material-by-year table. That makes it possible to separate a change in total tonnage from a change in the mix of materials, rather than treating a falling total as evidence that every material fell.
Table 5. Wisconsin recyclable materials sent to end markets from self-certified MRFs, in tons
Source: Wisconsin Department of Natural Resources, Wisconsin Recyclable Materials Sent to End Markets from Self-Certified Materials Recovery Facilities, by Year (in tons), published December 2025. Tonnage columns are the published source values; the share column is calculated by Green Bay Dock Door Repair Research. Verified September 15, 2026.
Dataset: Complete Wisconsin MRF series — CSV. The file includes all six materials, total tons, OCC share of total, OCC share of paper fiber, OCC year-over-year change, coverage, source and verification date.
Table 6. What changed across the decade in Wisconsin’s reported MRF output
| Material | 2015 tons | 2024 tons | Change | Percent change |
|---|---|---|---|---|
| Corrugated (OCC) | 234,108 | 332,954 | +98,846 | +42.2% |
| All other paper | 304,613 | 167,542 | −137,071 | −45.0% |
| Aluminum containers | 8,316 | 14,224 | +5,908 | +71.0% |
| Steel and bimetal containers | 23,436 | 24,254 | +818 | +3.5% |
| Glass containers | 126,301 | 105,125 | −21,176 | −16.8% |
| Plastic containers #1–7 | 41,486 | 43,463 | +1,977 | +4.8% |
| Everything except corrugated | 504,154 | 354,607 | −149,547 | −29.7% |
| All materials | 738,262 | 687,561 | −50,701 | −6.9% |
Source: calculated by Green Bay Dock Door Repair Research from Wisconsin DNR’s end-market table. “Everything except corrugated” uses published total tons minus OCC tons in each endpoint year. Verified September 15, 2026.
Dataset: Wisconsin material changes — CSV.
Three findings from the Wisconsin series
Corrugated offsets part of the combined decline in other material. Reported total MRF output fell 6.9% over the decade. Strip out corrugated and the combined decline is 29.7%. Corrugated gained 98,846 tons while the non-OCC remainder lost 149,547 tons, leaving the total down 50,701 tons. Aluminum, steel and plastics did not each decline; the combined remainder did. These are calculations from the source table, not a claim about the cause of the change. Wisconsin DNR inputs.
2019 is the crossover year. That is the first year in the 2015–2024 series when corrugated outweighed all other recyclable paper combined—306,621 tons against 271,346. By 2024 corrugated was 66.5% of the paper fiber those facilities shipped. The table shows rising OCC and falling other-paper output; it does not separate e-commerce boxes from other corrugated or establish how much of the other-paper change came from newsprint or office paper. Wisconsin DNR inputs.
Peak output and peak cardboard are different years. Total reported output peaked in 2019 at 768,835 tons. Corrugated peaked in 2024 at 332,954 tons, the highest figure in the displayed series. Neither statement extends beyond the years supplied by DNR’s table. Wisconsin DNR inputs.
The calculations behind the headline finding are short enough to reproduce directly:
OCC tonnage change: 332,954 − 234,108 = 98,846 tons
OCC percent change: 98,846 / 234,108 × 100 = 42.2%
2024 OCC output share: 332,954 / 687,561 × 100 = 48.4%
2024 OCC paper-fiber share: 332,954 / (332,954 + 167,542) × 100 = 66.5%
2015 non-OCC output: 738,262 − 234,108 = 504,154 tons
2024 non-OCC output: 687,561 − 332,954 = 354,607 tons
Non-OCC percent change: (354,607 / 504,154 − 1) × 100 = −29.7%
What these numbers are not. They are reported facility output, not a statewide recycling rate. There is no generation denominator here, so nothing in this table says what share of Wisconsin’s cardboard got recycled. The reporting cohort is self-certified facilities, and the published table does not establish that the same facilities reported every year. Collection and facility-output totals describe overlapping stages; adding them can double-count material. DNR’s dataset descriptions; MRF reporting guidance.
A second Wisconsin series pointing in the same direction
The Wisconsin Policy Forum’s original analysis of DNR responsible-unit data reported that corrugated collected through those programs rose from 53,974 tons in 2013 to 109,651 tons in 2022, while all other recyclable paper fell 35.6%. We verified those published findings against the Forum’s analysis, not by rebuilding its underlying 2013 returns. Wisconsin Policy Forum analysis.
That series has a different scope from MRF end-market shipments. DNR distinguishes responsible-unit collection reporting from facility-output reporting, so the smaller quantities are not missing tons to be added to Table 5. The two analyses point in the same direction over their respective periods, but they are not independent measurements of one identical flow. DNR’s coverage descriptions.
Where Wisconsin’s recovered corrugated can go
Green Bay Packaging operates a Green Bay mill using recycled fiber, including old corrugated containers and mixed paper. Its machine supplier, Voith, gives the new PM 4 a designed annual capacity of 685,000 U.S. short tons of testliner. That is a capacity specification, not measured annual production and not a quantity of Wisconsin OCC proven to have reached the mill. Green Bay Packaging mill profile; Voith PM 4 project record.
Green Bay Packaging’s production announcement dates the first reel to March 11, 2021. WEDC describes the project as Wisconsin’s first new paper mill in more than 30 years. Those dated project descriptions do not establish the plant’s current annual utilization. Company production announcement; WEDC project profile.
The investment figure is published two ways, and we show both rather than picking one: the company’s March 2021 announcement describes more than $500 million, while WEDC’s project profile describes more than $600 million. These are differently stated lower bounds from identified sources, not two exact totals that should be averaged or a demonstrated cost overrun. Green Bay Packaging; Wisconsin Economic Development Corporation.
The mill supplies local industrial context for recovered fiber. The DNR table does not identify each load’s destination, so this page does not claim that the state’s reported cardboard shipments all—or predominantly—went to that plant.
What can Brown County’s recycling record actually tell you?
Brown County’s detailed recycling record reports 24,697 tons of single-stream recyclables hauled to the Tri-County MRF in 2025, versus 35,033 tons in 2021. That is a commingled, all-material transfer-station series. The cited recycling section supplies neither a cardboard-only quantity nor a cardboard-generation denominator, so it cannot produce a county cardboard recycling rate. Brown County 2025 Annual Report, printed page 5.
Table 7. Brown County Recycling Transfer Station, single-stream tonnage
| Year | Single-stream recyclables, tons | Tier |
|---|---|---|
| 2021 | 35,033 | ★ |
| 2022 | 32,746 | ★ |
| 2023 | 31,657 | ★ |
| 2024 | 29,030 | ★ |
| 2025 | 24,697 | ★ |
Source: Brown County Port & Resource Recovery Department, 2025 Annual Report, recycling section, printed page 5. All five totals were checked against the chart labels; the 2025 value also appears in the detailed text. ★ denotes direct verification of the reported values. Verified September 15, 2026.
Source discrepancy: the report’s director introduction gives 24,500 tons for 2025 recycling, while the detailed recycling text and chart both give 24,697 tons. This table uses the detailed text/chart value and preserves the difference in the dataset note. The report does not explain the difference, so this page does not silently label it rounding or average the two. Report, printed pages 1 and 5.
Dataset: Brown County transfer-station series — CSV. It contains year, single-stream tons, material scope, empty cardboard-only quantity and rate fields, the reason those fields are empty, routing notes, source discrepancy and provenance.
Which routing change does the county document?
The county says WM and GFL opened new commercial MRFs in 2024, contributing to less commercial recycling material reaching the BOW facility. It also reports that the Tri-County MRF processed just under 80,000 tons of recyclables in 2025. Those are the county’s explanations and figures, not a decomposition of the entire 2021–2025 transfer-station decline. Report, printed page 5.
A falling number on one route cannot, by itself, establish whether Brown County residents and businesses recycled more or less cardboard overall. We leave the cardboard fields null rather than zero. Zero would assert that no cardboard was recycled; null says that this record does not provide the measurement.
Useful context from the same report
The facility operates within the Brown–Outagamie–Winnebago regional agreement, known as BOW. The county describes it as one of the largest publicly owned and operated single-stream recycling facilities in the country, reports AI-assisted robotic sorting, and says it serves customers in more than ten northeast Wisconsin counties. The size description is the county’s, not an independently compiled facility ranking. Report, printed pages 2 and 5.
The director’s introduction reports 385,747 tons of solid waste received at Brown County’s South Landfill in 2025. The separate solid-waste chapter uses 385,750 tons for its transfer-plus-direct-haul account. These are separately labeled solid-waste statements, not cardboard data or totals to combine with the recycling series. Report, printed pages 1 and 4.
The county also flags lithium batteries as a fire hazard at waste and recycling facilities. Its hazardous-material program, rather than the ordinary commingled-recycling stream, is the relevant official reference for household battery handling. Report, printed pages 1 and 6–7.
What is recovered cardboard worth, and where can you check it for free?
A free federal measure of price movement is BLS Producer Price Index series WPU091203, “Corrugated Recyclable Paper,” distributed through FRED. It rose 35.3% from November 2025 to August 2026 in the observation vintage retrieved September 15, 2026. The series is monthly, not seasonally adjusted, and an index—not a dollar-per-ton quote. Series information; Observation table.
Table 8. BLS Producer Price Index, corrugated recyclable paper (WPU091203)
Source: U.S. Bureau of Labor Statistics, Producer Price Index: Corrugated Recyclable Paper, WPU091203, observations retrieved through FRED’s full data table. Series last updated September 10, 2026, at 11:54 a.m. CDT; latest observation August 2026. Retrieved and verified September 15, 2026. Percentage changes calculated by Green Bay Dock Door Repair Research.
Dataset: Corrugated recyclable paper price index — CSV. Includes all displayed observations, series ID, index base, seasonal-adjustment status, source-update time and retrieval date.
Calculated from those observations, the index rose 35.3% from November 2025 to August 2026 and 29.1% from January 2026 to August 2026. The endpoints are named because “year to date” could otherwise be read as a comparison against December. November is the lowest observation in the displayed window, not a claimed all-time low.
November 2025 → August 2026:
(254.991 / 188.425 − 1) × 100 = 35.3%

January 2026 → August 2026:
(254.991 / 197.481 − 1) × 100 = 29.1%
An index is not a price. The base is 1982 = 100; an observation of 254.991 does not mean a ton of cardboard sells for $254.991. It measures relative price movement in the defined series, not the amount a particular generator receives for a bale or the cost of collection. BLS/FRED units and series description.
A dollar-per-ton statement needs its own source, transaction period, material specification and pricing basis. The table supplies none of those transaction-level dollar amounts, and this page does not manufacture a “current cardboard price” by relabeling an index value. For a reproducible official measure of direction and magnitude across the named months, the index is the relevant asset.
This is a dated observation snapshot. If the producer later revises a month, a new edition should identify the revision and preserve the old download rather than quietly changing the historical arithmetic.
Is it actually illegal to put cardboard in the trash?
Wisconsin generally prohibits landfill and incinerator disposal of corrugated cardboard and other containerboard at residential and nonresidential locations statewide, subject to DNR’s stated exceptions. Massachusetts, Connecticut and Vermont also have the cardboard requirements summarized below. This is a four-state reference, not a complete national legal inventory or a determination for a particular waste load. Wisconsin DNR; MassDEP; Connecticut DEEP; Vermont ANR.
Table 9. Selected states with verified cardboard recycling or disposal requirements
| State | Scope | Issuing authority / rule reference | Tier |
|---|---|---|---|
| Wisconsin | Statewide residential and nonresidential locations; exceptions below | Wisconsin DNR disposal-ban guidance; responsible-unit requirements | ★ |
| Massachusetts | Recyclable paper, cardboard and paperboard banned from disposal or transfer for disposal | MassDEP guide; 310 CMR 19.017 | ★ |
| Connecticut | Cardboard is a mandatory recyclable; definition includes a minimum-contamination condition | R.C.S.A. § 22a-241b-2(a)(1)(B); DEEP cardboard guidance | ★ |
| Vermont | Mandated recyclables, including paper/cardboard, banned from disposal since July 1, 2015 | Vermont ANR, Universal Recycling Law summary | ★ |
Source: issuing agencies and the official Connecticut regulation linked in each row. Verified September 15, 2026. ★ means the summarized requirement was checked against the named primary guidance or regulation; it does not imply that every exemption or local ordinance is reproduced here.
Dataset: Selected state cardboard-rule references — CSV. Includes the state, bounded summary, rule or guidance reference, conditions, primary URL and verification date.
Wisconsin exceptions that change the answer
Recycling programs in the waste-to-energy service areas in La Crosse and Barron counties may send recyclable paper, including cardboard, to energy recovery. DNR says local ordinances in those areas may still require recycling. The exception concerns specified service areas and routes, not a statewide permission to discard cardboard. Wisconsin DNR, exceptions section.
DNR also describes exceptions involving emergencies, unintentionally contaminated material and approved beneficial reuse in a landfill. Those conditions are why “every landfill and incinerator, without exception” would be wrong. Separately, DNR permits disposal of specified foam polystyrene and plastic containers numbered 3–7 because of inadequate recycling markets; that plastics provision is not a blanket cardboard exception. Wisconsin DNR disposal guidance.
What the four-state comparison does not decide
The table distinguishes a state-level requirement from its material definition and exceptions. Connecticut’s cited definition, for example, describes cardboard with minimal contamination; Massachusetts names recyclable paper, cardboard and paperboard. A prohibition on specified material is not automatically a ruling on every coated, contaminated or mixed load. Connecticut definitions; MassDEP guide.
For an actual compliance decision, the issuing agency’s current requirements and the relevant local program govern. No recycling rate in the national or Wisconsin tables establishes whether a particular disposal action complies with those rules.
Why are these numbers moving right now?
The 2025 production and consumption figures and the 2026 price observations moved in different directions. AF&PA reported lower containerboard production and recovered-fiber consumption in 2025, while the displayed BLS index subsequently rose. Together these describe changes in different measures; they do not isolate one cause or establish how much any one factor moved the recycling rate. AF&PA survey; BLS/FRED observations.
Supply. AF&PA reported containerboard production down 4.4% in 2025 to 36.1 million tons, capacity down 5.1%, and an operating rate of 91.9%. These are production-system figures, not a direct measure of cardboard discarded in that year or a specified lag to future recovery. AF&PA capacity survey.
Mill demand. U.S. mills consumed 31.4 million tons of recycled paper in 2025, down 1.3 million tons from 2024, while AF&PA’s survey reports recovered-fiber consumption down 4.0%. The published totals do not, by themselves, identify how many mills stopped buying or the utilization of every remaining buyer. AF&PA recycling release; capacity and fiber survey.
Exports. AF&PA’s 2024 release reported lower recycled-paper exports, particularly from weaker Asian demand, even as U.S. mill consumption increased. It also reported increased net containers entering the country. Those observations explain why domestic use alone does not determine the national recovery calculation; they do not provide a clean estimate of an export effect on the cardboard rate. AF&PA’s 2024 release.
Price. In the retrieved vintage, the BLS index increased each month from November 2025 through August 2026. That is a reproducible observation about price movement, not proof that demand alone strengthened or that a particular mill’s margin improved. The free federal data support the first statement, not the additional causal claims. BLS/FRED observation table.
The reporting periods should stay visible. A 2025 annual production change and a November 2025–August 2026 price change are not simultaneous measurements over the same interval. Putting them together supplies context; it does not turn them into an econometric explanation.
What do these statistics not establish?
The national rates are published estimates, the Wisconsin series is reported facility output, and the Brown County series is one all-material transfer route. None supplies a universal probability that a box placed in a bin will become a new box. The following boundaries apply to the tables and downloadable files, not just to the surrounding prose. AF&PA methodology; DNR reporting scopes; Brown County report.
The current national range comes from an industry association. AF&PA states that packaging trade and other inputs require estimates. We attribute the results to AF&PA and do not treat an industry release as independent field measurement. Its reported outside methodological review is also attributed to the association, not presented as a review commissioned by this publication. AF&PA methodology.
EPA’s figure is historical and modeled. The 96.5% covers 2018 and rests on estimated generation and recycling, not a count of individual boxes entering recycling bins. The current EPA pages inspected here still use that historical baseline. EPA tables; EPA material page.
The FBA-derived comparison is not published as verified data. Its numerical report inputs were not independently inspected. Even with verified area and basis weight, comparing estimated shipped-board mass with recovered-cardboard tonnage would not isolate net imported packaging. The dimensional formula is retained as a method explanation, not a completed measurement.
The Wisconsin series is facility output, not a recycling rate. It has no generation denominator. A share of shipments is not a share of cardboard recovered, the reporting cohort is not established as fixed, and collection/output totals can overlap. Published totals are retained even where component sums differ by one or two tons. DNR source table; DNR coverage notes.
The Brown County series is all-material throughput on a reported route. It supports no cardboard-only quantity or rate. The county documents a routing-related factor, but the report does not apportion the entire multi-year decline or resolve its introductory-versus-detailed 2025 recycling totals. Brown County annual report.
The price series is an index and a vintage. It reports change from a 1982 base, not dollars per ton. The displayed values belong to the September 15, 2026 retrieval snapshot; later revisions require a new documented calculation. BLS/FRED metadata.
The state-rule table is deliberately bounded. It covers the four named states and does not rank them, count all jurisdictions with restrictions, or reproduce every local requirement. Conditions and exceptions are part of the rule, not optional qualifications to be discarded when quoting it.
Figures deliberately excluded from this edition
This edition excludes annual U.S. box-count claims without a verified original source; per-ton tree, water, oil and energy equivalents without a defensible calculation; global recycling percentages presented as if they were comparable to the U.S. series; and county cardboard percentages inferred from mixed-material throughput.
It also excludes the uninspected FBA annual-report values, the shipment-versus-recovery import-gap claim, the unverified historical AF&PA restatement and numerical independent-model estimates. Exclusion means the evidence was insufficient for this edition. It does not establish that every excluded number is false or that no additional primary record exists.
What an updated edition would need before making a stronger claim
A state or county cardboard recycling rate needs a matching cardboard-only numerator and generation denominator for the same geography and period. A dollar-per-ton price needs an identified price assessment or transaction dataset. A shipping-versus-recovery balance needs consistent units, material definitions and trade treatment. The existing source tables do not supply those missing pieces by themselves.
The calculations in this page stop where those records stop. A missing measurement stays missing; it is not estimated solely to fill a table cell.
What are this page’s attribution details?
The record below identifies this publication and its data edition. Individual table captions identify the original producers; Wisconsin shares and changes and the named-month price-index calculations are attributed to this publication’s analysis.
How to cite this page
Publication: Green Bay Dock Door Repair Research
Page: Cardboard Recycling Statistics: U.S. Rates, Tonnage, and What Each Number Measures
URL: https://greenbaydockdoorrepair.com/research/cardboard-recycling-statistics/
Data edition: 2025 national figures, with historical, state, county and monthly-price periods labeled separately
Last verified: September 15, 2026
Dataset version: 2026-09-15-audited
Green Bay Dock Door Repair Research is the independent research and reference section of greenbaydockdoorrepair.com. It is part of the same website, not a separate government agency, laboratory or nonprofit research institution.
The page, section, statistic and table anchors identify specific parts of this edition. Source dates, data years and measurement labels remain part of the referenced finding; the verification date does not replace them.
What questions come up about cardboard recycling numbers?
The answers below preserve each figure’s source, period and denominator. They distinguish what the published records establish from what the available data do not measure.
What percentage of U.S. cardboard was recycled in 2025?
AF&PA estimates 70–75% of cardboard available for recovery was recycled in the United States in 2025, on more than 33 million tons. The rate was released August 28, 2026. AF&PA publishes a range because parts of the calculation, including packaging trade, are estimated rather than directly measured.
Sources: American Forest & Paper Association; American Forest & Paper Association.
Is EPA’s 96.5% a current cardboard recycling rate?
No. It describes 2018 and was published in December 2020. It divides estimated corrugated boxes recycled by estimated corrugated boxes generated. The EPA pages checked on September 15, 2026 still use that historical baseline; it should not be relabeled as a 2025 or 2026 measurement.
Sources: U.S. Environmental Protection Agency; U.S. Environmental Protection Agency.
Did U.S. cardboard recycling fall from 96.5% to 70–75%?
That comparison does not establish a decline. The numbers come from different publishers, different years and different measurement frameworks. AF&PA documents changes to its methodology, but the figures in this page do not form a single harmonized series or isolate a numerical methodology effect for 2022.
Sources: U.S. Environmental Protection Agency; American Forest & Paper Association.
How many tons of cardboard does the U.S. recycle each year?
AF&PA reports more than 33 million tons of cardboard recycled in 2025, about 90,000 tons a day. “More than” is part of the finding, not an exact 33-million-ton count. This recovery total cannot be subtracted from an unmatched domestic board-shipment estimate to measure imported packaging.
Sources: American Forest & Paper Association; American Forest & Paper Association.
Does 48.4% mean Wisconsin recycled about half its cardboard?
No. That is corrugated’s share of the total tonnage Wisconsin’s reporting MRFs shipped to end markets in 2024. It is an output-composition share, calculated as 332,954 divided by 687,561. The table does not provide the generation denominator needed for a statewide cardboard recycling rate.
Sources: Wisconsin Department of Natural Resources; Wisconsin Department of Natural Resources.
How much cardboard does Brown County recycle?
The cited county recycling section does not answer that. Its detailed 2025 text and chart give 24,697 tons of all-material single-stream recyclables, while the introduction says 24,500 tons. Neither provides cardboard-only tonnage or a cardboard-generation denominator. The dataset retains the detailed throughput value and leaves cardboard-specific fields null.
Sources: Brown County Port & Resource Recovery Department.
Are U.S. tons and metric tonnes interchangeable in these tables?
No. A U.S. short ton is 2,000 pounds; a metric tonne is 1,000 kilograms and is roughly 10% heavier. EPA explicitly uses U.S. short tons. The AF&PA, Wisconsin DNR and county rows retain their source label of tons rather than silently assigning or converting units for cross-source calculations.
Sources: National Institute of Standards and Technology; National Institute of Standards and Technology; U.S. Environmental Protection Agency.
Is it against the law to throw cardboard away?
Wisconsin generally bans landfill and incinerator disposal of corrugated cardboard and other containerboard at residential and nonresidential locations, subject to DNR’s stated exceptions. Those include specified energy-recovery service areas and other conditions. Massachusetts, Connecticut and Vermont have the distinct requirements summarized in Table 9; that table is not a complete national compliance guide.
Sources: Wisconsin Department of Natural Resources; Massachusetts Department of Environmental Protection; Connecticut Department of Energy and Environmental Protection; Vermont Agency of Natural Resources.
Which primary sources support these figures?
These are the issuing agencies, original statistical producers, company and equipment-producer records, and original analytical publications used in this edition. Source notes distinguish numerical evidence from catalog or access pages; a listed resource is not a claim that its inaccessible underlying report was inspected.
-
American Forest & Paper Association. Paper Industry Announces 2025 U.S. Paper Recycling Rates. Published 2026-08-28. 2025 national rates and mill consumption. Verified September 15, 2026.
-
American Forest & Paper Association. Paper & Cardboard Recycling Facts. 2025 recycling figures and destination overview. Verified September 15, 2026.
-
American Forest & Paper Association. AF&PA Recycling Rate Methodology. Four methodology changes, recovery denominator, and estimated packaging trade. Verified September 15, 2026.
-
American Forest & Paper Association. How Much Cardboard Is Recycled?. Published 2026-08-31. 2025 cardboard rate and tonnage. Verified September 15, 2026.
-
American Forest & Paper Association. Paper Industry Announces 2024 U.S. Paper Recycling Rates. Published 2025-08-12. 2024 rates, mill consumption and trade; related cardboard summary labels its 2024 tonnage. Verified September 15, 2026.
-
American Forest & Paper Association. How Much Paper Was Recycled in 2023?. Published 2024-11-14. 2023 cardboard rate. Verified September 15, 2026.
-
American Forest & Paper Association. AF&PA Releases 66th Annual Paper Industry Capacity and Fiber Consumption Survey. Published 2026-05-29. 2025 production, capacity, operating rate and recovered-fiber consumption. Verified September 15, 2026.
-
U.S. Environmental Protection Agency. Advancing Sustainable Materials Management: 2018 Tables and Figures. Published 2020-12. Table 5, printed p. 6 / PDF p. 10; Table 25, printed p. 39 / PDF p. 43. Verified September 15, 2026.
-
U.S. Environmental Protection Agency. Containers and Packaging: Product-Specific Data. 2018 corrugated generation, MSW share and product-category description. Verified September 15, 2026.
-
U.S. Environmental Protection Agency. Paper and Paperboard: Material-Specific Data. Historical 2018 paper and corrugated figures. Verified September 15, 2026.
-
Fibre Box Association. 2024 Fibre Box Association Annual Report — publisher catalog entry. Report availability and subject coverage only; report statistics not independently inspected. Verified September 15, 2026.
-
Fibre Box Association. What Is Corrugated?. Liner, medium, single-face and single-wall definitions. Verified September 15, 2026.
-
U.S. Bureau of Labor Statistics; distributed by Federal Reserve Bank of St. Louis. Producer Price Index: Corrugated Recyclable Paper, WPU091203. Monthly, not seasonally adjusted, index 1982=100; updated 2026-09-10. Verified September 15, 2026.
-
U.S. Bureau of Labor Statistics; distributed by Federal Reserve Bank of St. Louis. WPU091203 — full observation table. October 2025–August 2026 observations as retrieved 2026-09-15. Verified September 15, 2026.
-
Wisconsin Department of Natural Resources. Wisconsin Recyclable Materials Sent to End Markets from Self-Certified Materials Recovery Facilities, by Year (in tons). Published 2025-12. One-page material table, 2015–2024. Verified September 15, 2026.
-
Wisconsin Department of Natural Resources. Recycling Studies and Reports. Coverage of responsible-unit collection and MRF output datasets. Verified September 15, 2026.
-
Wisconsin Department of Natural Resources. Material Recovery Facilities. MRF reporting and self-certification. Verified September 15, 2026.
-
Wisconsin Department of Natural Resources. Responsible Unit Recycling Programs. Residential and nonresidential program scope. Verified September 15, 2026.
-
Wisconsin Department of Natural Resources. What to Recycle in Wisconsin. Banned materials; exceptions; La Crosse and Barron waste-to-energy areas. Verified September 15, 2026.
-
Brown County Port & Resource Recovery Department. 2025 Annual Report. 2025 report; printed pp. 1–2 and 4–5 / PDF pp. 2–3 and 5–6; recycling chart visually checked. Verified September 15, 2026.
-
Wisconsin Policy Forum. Wisconsin Recycling Changes. Original analysis of DNR responsible-unit data, 2013–2022; underlying 2013 returns not reprocessed here. Verified September 15, 2026.
-
Massachusetts Department of Environmental Protection. MassDEP Waste Disposal Bans. Issuer guidance: recyclable paper/cardboard/paperboard; 310 CMR 19.017. Verified September 15, 2026.
-
Connecticut Department of Energy and Environmental Protection. Corrugated Cardboard Recycling. Mandatory recycling and source separation. Verified September 15, 2026.
-
Connecticut eRegulations System. Regulations of Connecticut State Agencies: Designated Recycling. Sections 22a-241b-1(1)–(2) and 22a-241b-2(a)(1)(B). Verified September 15, 2026.
-
Vermont Agency of Natural Resources. Recycle and Compost. Universal Recycling Law: paper/cardboard disposal ban effective 2015-07-01. Verified September 15, 2026.
-
Green Bay Packaging. Green Bay Mill. Recycled-fiber inputs and Green Bay site. Verified September 15, 2026.
-
Green Bay Packaging. Green Bay Packaging New Recycled Paper Mill Begins Production. Published 2021-03-19. March 11, 2021 first reel and more than $500 million investment. Verified September 15, 2026.
-
Voith. Green Bay Packaging PM 4. Machine design capacity: 685,000 short tons of testliner per year; 2021 startup. Verified September 15, 2026.
-
Wisconsin Economic Development Corporation. Green Bay Packaging — Success Story. 2021 mill opening, more than 30-year interval, and investment described as more than $600 million. Verified September 15, 2026.
-
National Institute of Standards and Technology. Approximate Conversions from U.S. Customary Measures to Metric. Short ton = 2,000 pounds; approximate tonne conversion. Verified September 15, 2026.
-
National Institute of Standards and Technology. Approximate Conversions from Metric to U.S. Customary Measures. Metric tonne = 1,000 kilograms. Verified September 15, 2026.
-
Circular Ventures. A Fresh Look at OCC Recycling. Producer access page only; numerical presentation not independently inspected. Verified September 15, 2026.
Verification and update record
September 15, 2026 — verified edition. National rates, Wisconsin inputs, the Brown County chart and the displayed price observations were checked against the cited sources. The PPI table uses the September 10 source vintage through August 2026. The county’s conflicting introductory and detailed recycling totals are recorded, and unverified numerical claims are excluded.
AF&PA annual releases, EPA source tables, the next DNR end-market table, the next Brown County annual report and each new BLS observation vintage are the refresh triggers for their respective figures. Disposal guidance must be checked against the issuing agencies when that section is revised. A date change alone is not a data update.
This edition’s CSV and JSON files form one verification snapshot. Future substantive revisions should retain a dated copy of the prior files and state which source values, calculations or reporting boundaries changed. A new verification date must identify an actual check, not imply that a historical reference year became current.
Last verified: September 15, 2026
Green Bay Dock Door Repair Research — the independent research and reference section of greenbaydockdoorrepair.com.